I’ve watched sellers make the same mistake hundreds of times. They find a product that looks incredible — high views, lots of engagement, creators everywhere — and they rush to launch. Two weeks and several hundred dollars in ad spend later, they’re sitting on a negative ROI wondering what went wrong.
The product was already dead when they found it. They just didn’t know how to read the signs.
Saturation is the silent killer of dropshipping margins. And the frustrating part is that almost every “product research guide” on the internet tells you to “check for saturation” without ever explaining what that actually means in practice. What specifically should you look for? What numbers matter? When exactly does an opportunity cross the line from “competitive” to “too late”?
I’m going to give you a concrete framework. Not vague advice — an actual decision-making process you can apply to any product in under 10 minutes.
The Problem With How Most People Check Saturation
Here’s what the typical advice looks like. Google the product name. Check how many people are selling it on Amazon. Look at the TikTok Ad Library. If “too many” people are running ads, the product is saturated.
That advice isn’t wrong. But it’s dangerously incomplete.
The reason is timing. By the time a product appears in ad spy tools with dozens of active advertisers, it has already been saturated for days. Ad library data is a lagging indicator — it tells you what happened, not what’s happening now. You’re checking the rearview mirror and using it to decide whether to accelerate.
The sellers who consistently avoid saturation aren’t checking ad libraries first. They’re reading a different signal entirely.
Velocity Trend Direction: The Signal That Actually Matters
Before we get into the full framework, you need to understand one concept that changes the entire game.
Velocity is views per hour. Not total views. Not lifetime impressions. How fast a video’s views are growing right now.
But raw velocity alone doesn’t tell you whether a product is saturated. A product with 50,000 views per hour sounds incredible. And it might be — if that number was 10,000 yesterday. That’s a product exploding upward. You want in.
But what if it was 100,000 views per hour yesterday? Now it’s a product in decline. Same impressive-sounding number. Completely opposite reality.
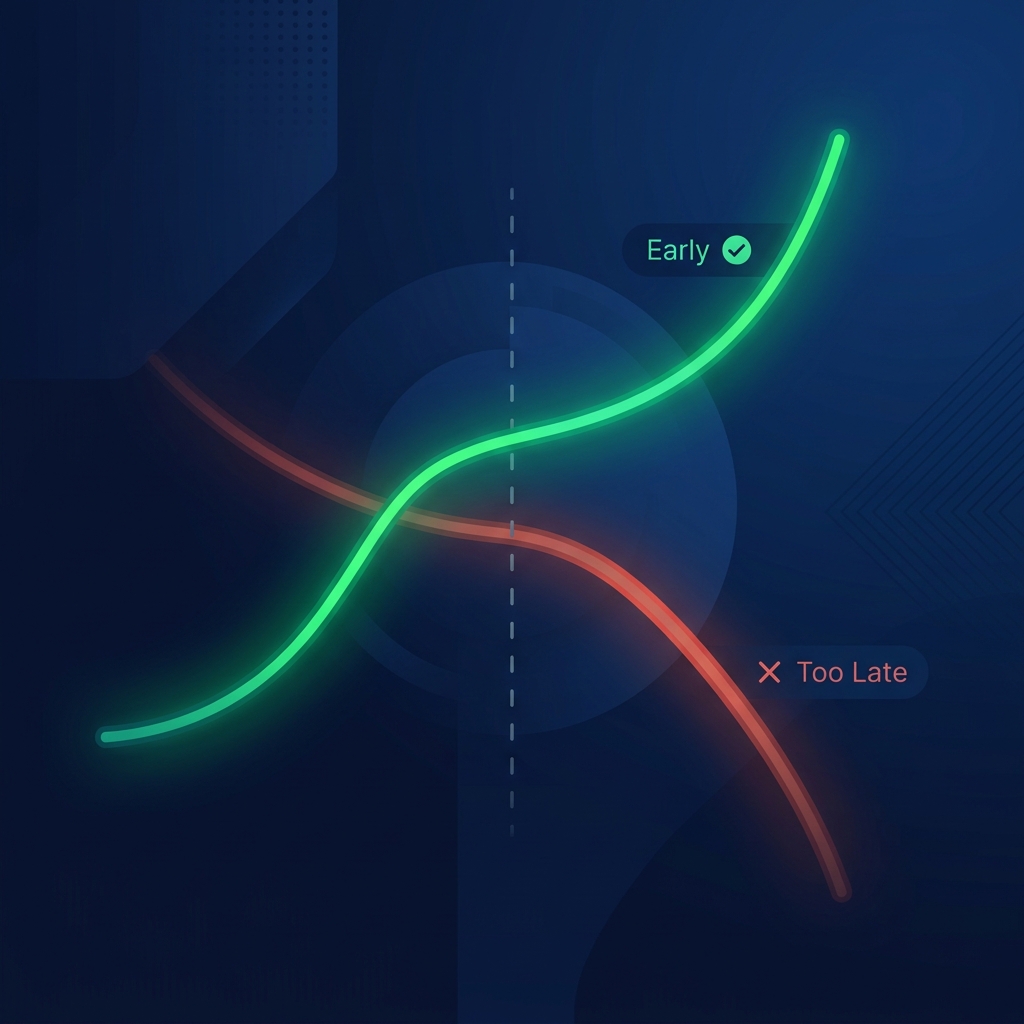
The direction of velocity change is the single most reliable saturation indicator available. Rising velocity means the wave is building. Falling velocity means the wave is crashing. Most product research tools can’t show you this distinction because they only capture snapshots — a number at one point in time. You need the trend.
This is the piece that every competitor article gets wrong. They talk about saturation in binary terms: saturated or not saturated. Reality is a curve. And where you enter that curve determines whether you make money or lose it.
The 4-Signal Saturation Framework
I use four signals, checked in this exact order. The order matters — each signal takes progressively more time, so if a product fails an early check, you don’t waste 30 minutes researching supply chains for a dead opportunity.
Signal 1: Velocity Trend (30 seconds)
Check the velocity trajectory first. This is the fastest and most decisive filter.
Accelerating velocity — views per hour increasing over the last few data points. This is a product in its growth phase. Even if competition exists, demand is expanding fast enough to absorb new sellers. Green light.
Stable velocity — roughly constant, fluctuating within a narrow range. The product has found its equilibrium. There might still be room, but the explosive growth phase is over. You’ll need stronger creative or a differentiated angle to compete. Yellow light.
Declining velocity — views per hour dropping over consecutive readings. This is the biggest red flag in product research. A product at 30,000 views per hour but declining is a worse bet than a product at 3,000 views per hour that’s climbing. The first one is a dying trend everyone is chasing. The second is a nascent opportunity nobody sees yet.
Most people skip this signal entirely because they don’t have access to velocity trend data. They look at a single snapshot — “this product has 50K views, must be hot!” — and miss the fact that it was at 200K views two days ago.
If you want to see velocity trends in real time, that’s what we built VelocitySpy for — it tracks organic TikTok videos hour by hour so you can see whether momentum is rising or falling. But even without a tool, you can approximate this manually by checking a product’s TikTok videos at two different times, 12 hours apart, and comparing view counts. It’s tedious, but it works.
Signal 2: Seller Density (2-3 minutes)
If velocity is stable or accelerating, check how many sellers are actually in the market.
Fewer than 5 independent sellers. This is the sweet spot. Demand is validated (people are buying) but competition is thin. Move fast — this window doesn’t last.
5 to 15 sellers. Competitive, but workable. You’ll need good creative and possibly a differentiated offer — a better landing page, a bundle, a faster shipping option. The product isn’t dead, but you can’t phone it in.
More than 15 sellers. Getting crowded. At this level, you’re mostly competing on ad spend and creative quality. Margins shrink because sellers start undercutting each other on price. Possible if you’re an experienced media buyer, but risky for anyone else.
More than 30 sellers. Walk away. Unless you have a genuinely unique angle that no one else is running, the math doesn’t work. Customer acquisition costs are inflated by competition, margins are compressed by price wars, and the product lifecycle is almost certainly in its final phase.
How to check: search the product name on TikTok and Instagram. Count how many different accounts are promoting it — look at usernames and store links to distinguish independent sellers from the same brand running multiple accounts. Then check the TikTok Creative Center and Facebook Ad Library for paid ads.
One important nuance: not all sellers are equal. Ten sellers where eight are running low-quality content from the same AliExpress listing images? Less threatening. Ten sellers where six have polished video creative and custom landing pages? That’s real competition.
Signal 3: Ad Library Saturation (2-3 minutes)
This is the check most people start with. I put it third because it’s a lagging indicator — by the time you see heavy ad library activity, the product is usually past its prime. But it’s still worth confirming.
Zero to 3 ads. Either the product is too new for paid advertising, or it’s a niche that doesn’t advertise on TikTok. Cross-reference with velocity data — if organic velocity is high and no one is running ads yet, you’ve found a genuine early opportunity.
3 to 10 ads, running for less than 2 weeks. Healthy early advertising phase. Sellers are testing, some are scaling. If the ads are recent and velocity is still climbing, there’s room.
10 to 30 ads, mixed durations. The wave is maturing. The early adopters are already scaling, and new entrants are joining daily. You can still win here if your creative is strong, but the margin of error is shrinking. You need to launch in days, not weeks.
30+ ads. This product has been through the grinder. The only sellers still profitable are the ones who got in early or who have genuinely superior creative. For a new entrant, this is almost always a losing proposition.
The ad library doesn’t just tell you how many ads exist — it tells you when they started. If you see 20 ads but they all launched in the last 3 days, that’s very different from 20 ads that have been running for 3 weeks. The first scenario means the product just entered its advertising phase (still relatively early). The second means the market has had ample time to saturate.
Signal 4: Marketplace Presence (2-3 minutes)
The final check. Search for the product on Amazon and Google.
Zero Amazon listings. Rare for a genuinely trending product, but it happens. This is either very early stage or a product that doesn’t translate well to Amazon. Either way, one fewer competitor channel to worry about.
1 to 5 Amazon listings with minimal reviews. The product is starting to appear but hasn’t been established yet. Still a viable window.
5+ Amazon listings with dozens of reviews. The product has been around long enough for Amazon sellers to build review history. At this point, any customer who Googles the product before buying will find Amazon listings at lower prices with Prime shipping. You’re fighting an uphill battle.
Amazon choice or best seller badge. Done. The product has become a commodity. Move on.
A quick Google search for “[product name] shop” or “[product name] buy” reveals how many Shopify stores are already selling it. More than 10 results dominated by independent stores? The market knows about this product. Fewer than 5? You might still be early enough.
Why Most Product Research Is Structurally Too Slow
Here’s something that I don’t think enough sellers internalize.
The average product lifecycle on TikTok has compressed dramatically. A few years ago, you could discover a trending product, spend a week sourcing it, take another week building your store, and still catch the wave. That timeline doesn’t work anymore.
The typical cycle now looks roughly like this. Days one through three: a creator posts an organic video and it starts gaining momentum. Days three through five: more creators notice and make their own videos. Organic velocity accelerates. Days five through seven: the first sellers launch paid ads. The product appears in ad spy tools. Days seven through fourteen: the market floods. Margins collapse. Late entrants lose money.
If your research process begins with checking the ad library, you’re typically entering this cycle at day seven or later. By that point, the best margins are gone. And if you add a week of sourcing and store-building, you’re launching at day fourteen — which is essentially the end.
The sellers who consistently find unsaturated products are working at days one through three. They’re tracking organic viral momentum before paid ads exist. That’s the structural advantage.
The “Too Late” Checklist
I’ll make this as concrete as possible. If a product triggers three or more of these signals, it’s too late:
Velocity is declining across multiple videos. Not just one video losing steam — that’s normal. But if the product’s best-performing videos are all decelerating, the trend is dying.
More than 15 independent sellers are actively promoting it on TikTok. Count unique accounts, not unique videos — one seller often runs 3-5 videos from the same account.
The product appears in multiple “winning product” lists from YouTube channels and blogs. Once the content creators who make “top 10 winning products” videos feature a product, every casual dropshipper sees it. The flood starts within 48 hours of that coverage.
Amazon has established listings with reviews. This means the product has existed long enough for traditional e-commerce to catch up. The price floor is now set by Amazon sellers with fulfillment advantages you can’t match.
More than 20 ads in the TikTok or Facebook ad library, with the oldest running for more than 2 weeks. This indicates the advertising phase is well advanced, with early movers already holding optimized campaigns that will outperform your initial tests.
The product is a “generic” commodity that can’t be differentiated. LED strip lights, garlic presses, phone cases — these products cycle through saturation every few months. Unless you have a specific variant or angle that nobody else is running, commodity products are not worth chasing at any stage.
The “Still Worth It” Checklist
On the flip side, these signals suggest a product still has runway:
Velocity is accelerating across multiple creator videos. Increasing views per hour means demand is outpacing supply. More sellers can enter without destroying margins because the pie is still growing.
Fewer than 5 independent sellers with organic content. Low seller count combined with high velocity is the most bullish signal in product research. This is the early window — before most people even know the product exists.
No or very few paid ads. A product gaining organic traction without paid advertising hasn’t entered the “ad spy tool” phase yet. Most of your competition hasn’t found it.
The product was first detected within the last week. Freshness matters enormously. A product that’s been trending for 3 weeks and is still accelerating is exceptional. A product that’s been trending for 3 days and is accelerating is common at this early stage — but the opportunity is real.
Multiple independent creators going viral with it. Not the same brand running multiple accounts — genuinely unrelated people posting videos about the same product and all getting traction. This validates consumer demand in a way that nothing else can. Our trending pages show exactly this kind of multi-creator validation, broken down by niche.
Competitive vs. Saturated: They’re Not the Same Thing
One more distinction that I think gets lost in most product research advice.
A competitive product is one where multiple sellers are actively advertising and selling, but demand is still rising. The market is growing. More sellers can enter because there are more customers than sellers can serve. In a competitive market, execution quality determines who wins — better creative, better landing pages, faster shipping.
A saturated product is one where seller count has outpaced demand. The market is flat or shrinking while new sellers keep arriving. This is where margins die. Even good execution can’t save you because the fundamental math doesn’t work — too many sellers fighting over too few buyers.
The distinction is entirely about the relationship between demand growth and supply growth. And the only way to measure demand growth in real time is through velocity tracking. Ad library data tells you about supply growth (how many sellers are advertising). View count tells you about historical demand. But velocity trend direction tells you whether current demand is growing, stable, or shrinking — which is the only thing that determines whether the market has room for one more seller.
What to Do When You’re on the Fence
Sometimes a product sits right on the boundary. Velocity is high but stable — not clearly accelerating or declining. Seller count is moderate. A few ads exist but not a flood. What do you do?
Three things can tip the decision.
First, check the creative landscape. Are all existing sellers running similar content — same angles, same hooks, same style? If so, there’s an opening for someone who brings a genuinely different creative approach. A new angle can carve out space even in a moderately crowded market.
Second, look at whether you can differentiate the offer. Can you bundle the product with something complementary? Can you position it for a specific audience that nobody else is targeting? Can you offer faster shipping through a domestic supplier? A differentiated offer competes on value, not price.
Third, test with absolute minimum investment. Don’t build a polished store. Put up a simple product page, run a small ad test, and see if the numbers work before committing real money. If cost per acquisition comes in under your target on a modest test, scale. If it doesn’t, you saved yourself weeks of wasted effort.
But honestly? When I’m on the fence about a product, I usually skip it and find one where the signals are clearly in the green zone. There are always more products trending. The ones where you have to convince yourself it’s worth trying are rarely the ones that pay off.
Why Speed Is the Only Sustainable Advantage
I keep coming back to this because I think it’s the most important takeaway.
In a market where product lifecycles are measured in days, the difference between finding a product at day two versus day eight is the difference between healthy margins and a losing trade. Every product research methodology either gets you there early or gets you there late. There’s no in-between.
Checking the ad library gets you there at day seven. Checking “top products” lists from YouTube channels gets you there at day ten. Scrolling TikTok manually might get you there at day two — if you spend hours every day doing it and get lucky.
Tracking organic velocity systematically is the only approach I’ve found that consistently identifies products in the first few days of their trend cycle, before paid ads appear and before the product research community picks up on them. It’s the reason we built VelocitySpy — to take the manual, luck-dependent process of scrolling TikTok and turn it into a data-driven system that surfaces products based on real-time momentum.
Whether you use a tool for it or do it manually, the principle is the same: the earlier you catch a product in its velocity curve, the more likely you are to enter before saturation kills the opportunity. Every day you wait reduces your expected return.
Putting It All Together
The next time you find a product that looks promising, run through these four checks in order:
Check velocity trend direction first — is momentum accelerating, stable, or declining? This takes 30 seconds and eliminates most dead opportunities immediately.
Check seller density — how many independent accounts are actively promoting this product? Fewer than five is ideal. More than fifteen is a warning sign.
Check the ad library — how many paid ads exist, and when did they start? Fresh ads are less concerning than ads that have been running for weeks.
Check marketplace presence — does Amazon already have established listings? Are Shopify stores already ranking in Google for the product name?
Three or more red signals means walk away. All green signals means move fast — you might be early enough to ride the wave before it crashes.
The framework is simple. The hard part is having the velocity data to make it work. You can approximate it manually, or you can use a tool that tracks it automatically. Either way, the sellers who read velocity trends will consistently enter markets before the sellers who rely on ad libraries and product lists. And in a game where timing is everything, that head start is the entire advantage.
If you want to start seeing velocity data for yourself, try VelocitySpy — start your free 3-day trial, cancel anytime.